Evaluate performance
Calculate market potential
Are you a European parts supplier or manufacturer looking for a way to streamline your inventory management and maximise your sales potential? Then explore our Fact-Based Replacement Rate & Total Market Calculation datasheet!
Fact-based Total Market Calculation
How does it work?
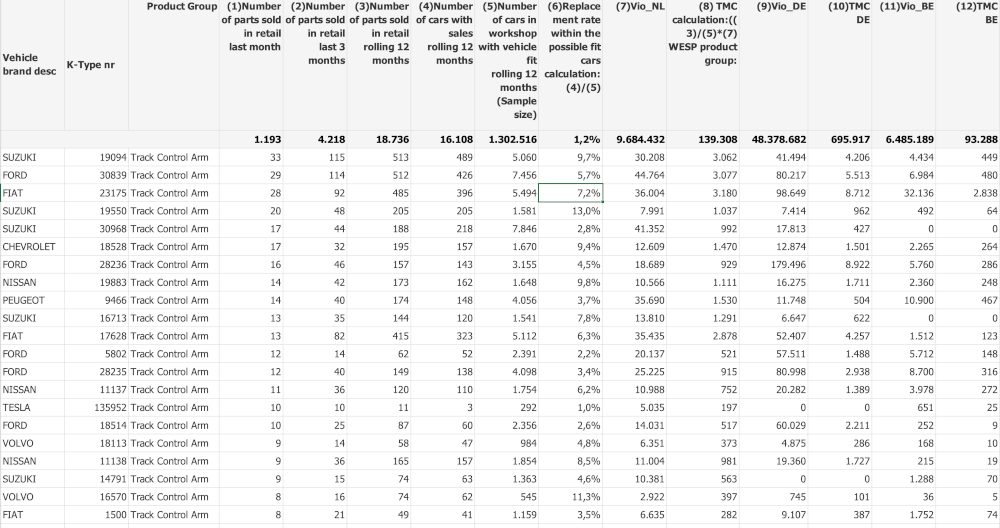
The fact-based replacement rate (FBRR) for the independent aftermarket quantifies the percentage of cars having parts replaced per part group based on actual workshop invoices. It provides insights into replacement part demand and informs category strategies, inventory management, marketing, and sales strategies, reflecting the demand for replacement parts in real-world scenarios.
We can use the FBRR to calculate the market size of a specific region.
Total Market Calculation = (Number of Parts Sold in Retail ➗ Number of Cars in Workshop with Vehicle Fit) ✖️ Vehicles in Operation (VIO)
Machine learning technologies are used to correct the dataset for variables such as the age of the car park, the number of vehicles in operation (VIO), and factors like mileage, GDP, road conditions, and temperature. These adjustments ensure that the FBRR data is more accurate and representative.
Delivering the output data based on OE-numbers and K-type allows for easy cross-referencing of product portfolios, evaluation of performance and calculation of market potential.
The Benefits
The Total Market Calculation can enhance your business in many ways:

Calculate market share
Discover how you perform compared to the overall market and identify growth opportunities.

Optimise inventory levels
Say goodbye to years of surplus and reduce long delivery times to keep your customers satisfied.

Maximise sales potential
Identify the best-selling parts and capitalise on growth opportunities.

Focus on product development
Use our data to determine where to prioritise your product development and stay one step ahead of your competitors.
Tailored to local differences
We understand that there are significant differences in various regions, such as car brands, driving conditions, and weather. Our data helps you determine where to place your inventory focus for specific parts and which expansions of your product portfolio could be lucrative.
Data driven decision making
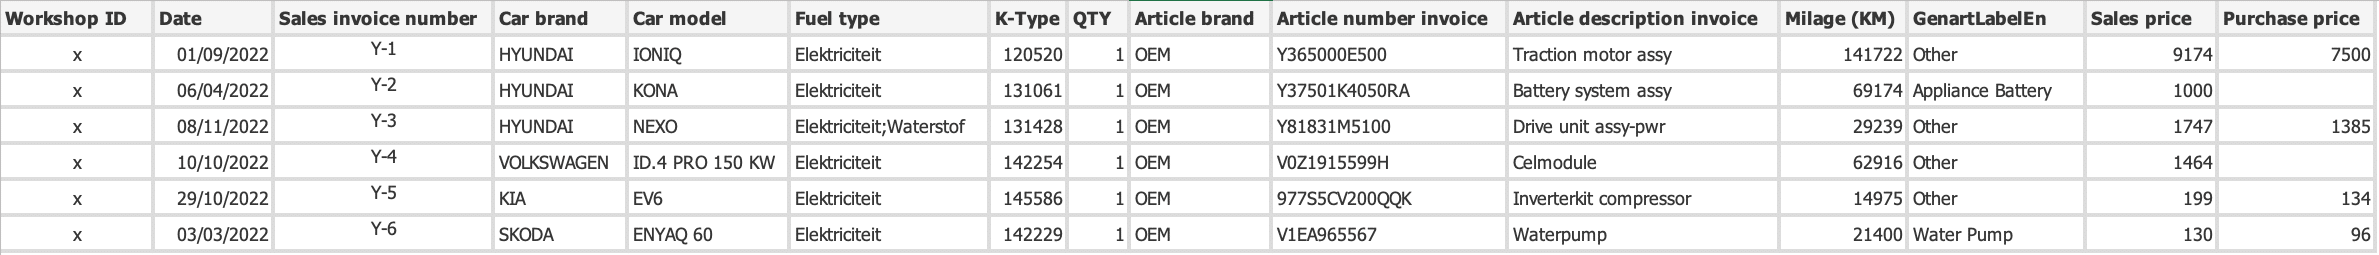
Through our deep dive data technology, we can classify workshop invoice information into standardised parts groups. In addition to using this data to help improve the performance of individual workshops, aggregated data from workshops is also valuable for analysis, and the purchasing loyalty of your franchisees is becoming increasingly important.
Let's talk
Contact us today and give your distribution business a competitive edge with WESP’s Fact-Based Replacement Rate & Total Market Calculation datasheet! But let’s start with getting to know each other and discovering where there is potential for your business.

