Stay competitive
Drive growth
Revolutionise your market analysis with the Parts Performance Dashboard and unlock the power of data-driven decision-making. Optimise your strategies, spot emerging trends, and drive growth in the retail market.
Experience the future of market analysis
Get to know your market
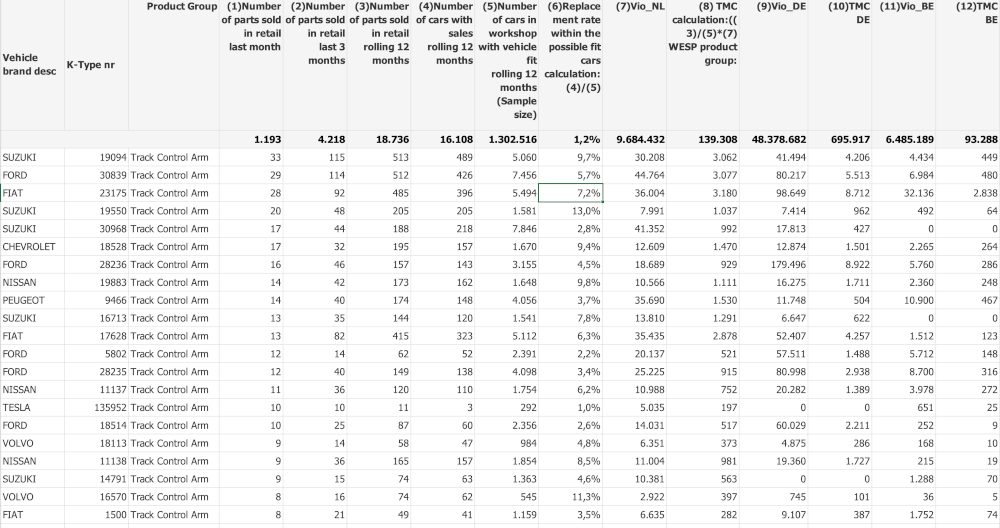
Experience the future of market analysis with our revolutionary product, the Parts Performance Dashboard (PPD). This cutting-edge tool empowers you to analyze aggregated retail market information effortlessly. With PPD, you can delve into summarized workshop data across key dimensions like time, location, parts groups (Genart), parts brand, and vehicle (K-type).
Discover whether the market is expanding based on invoice volume or revenue per invoice. Identify the brands that are gaining market share and uncover the relationship between market share and pricing. Monitor price fluctuations within different product groups and brands, enabling you to stay competitive and make informed pricing decisions.
Utilize PPD’s extrapolations based on service cost of ownership to gain a comprehensive understanding of the market on an annual basis. Whether it’s analyzing specific product groups, age categories, or regions, PPD provides the necessary tools to make accurate extrapolations.
Stay ahead of the competition by unraveling the driving factors behind retail channel margins. Gain insights into how your product group or brand impacts the performance and results within the market.

What is covered?
The following key areas are covered:

Market developments
Discover whether the market is growing based on the number of invoices or the increase in revenue per invoice.

Market share by brand
Identify the brands experiencing growth in market share. Explore the correlation between market share and pricing.
Pricing and price trends
Track the price changes for different product groups and brands. Compare your prices against the competition.

Total market calculations
Extrapolate service cost of ownership on an annual basis. The sample size is sufficient to extrapolate this data by product group, age, or region.

Retail margin
Uncover the primary drivers behind retail channel margins. Understand how your product group or brand influences the performance outcomes.
Experience the advantages
Data driven decision making
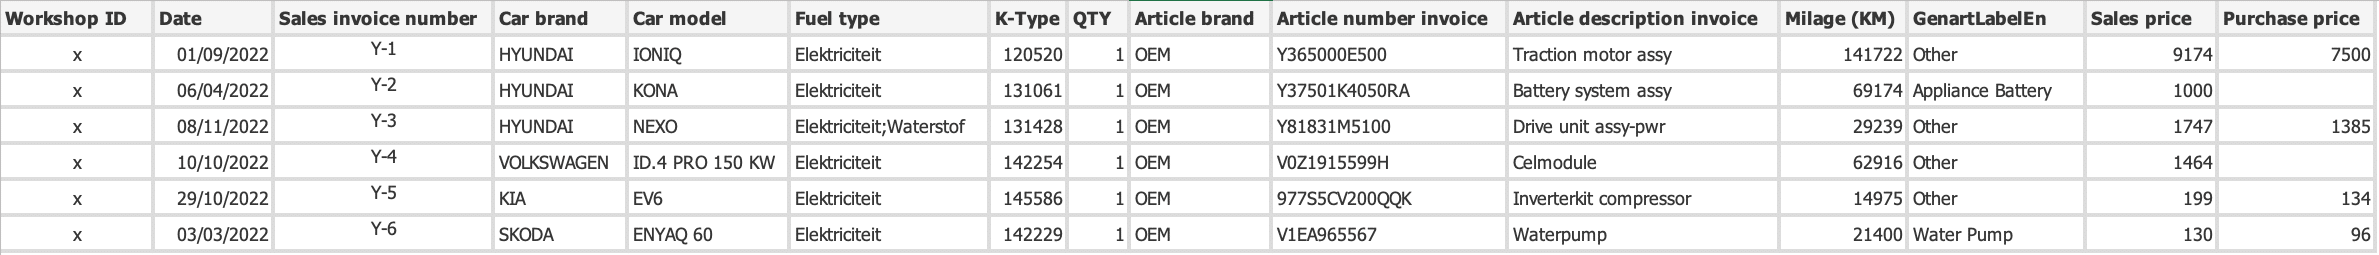
Through our deep dive data technology, we can classify workshop invoice information into standardized parts groups. In the past, WESP only used this data to help improve the performance of individual workshops. However, aggregated data from workshops is also interesting to analyse and purchasing loyalty of your franchisees is becoming increasingly important.
Request demo
Ready to explore the future of market analysis? Share your details below or give us a call for a demo. No strings attached.